|
Untitled Document
|
|
Untitled Document
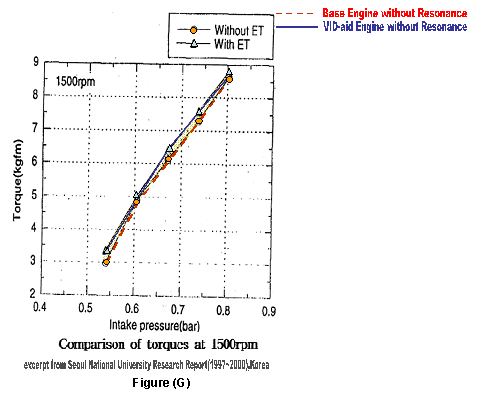
This
graph shows the consistent and stable
torque Improvement at the constant rpm 1500,under variable intake pressure.
With VID, Engine shows that
the straight performance increase under the whole intake pressure range. Meanwhile,
base engine’s performance is lower than that of resonance-engine at all the
intake pressure range.
| |
|
| |
 |
| |
|
| |
VID Harmony for Engine |
| |
|
| |
VID Role in view of torque improvement per load onto engine |
| |
|
| |
The following graph shows the engine performance change per load change.
While keeping the same rpm, we change the load amount consuming the generated
energy by engine and observe the torque change per load. The test result
tell us that some degree of combustion efficiency is also additionally improved
per load change.
Refer to Figure (G).
|
| |
 |
| |
|
| |
Referring to the above graph Figure (G), we see that the torque was improved
through the whole range of the intake pressure, not as specific range. This
is due to the fact that the combustion circumstance inside of the chamber
is continuously adjusted to bring the required chemical reactions per all
the strokes by getting the proper resonance-inducing frequency whenever
the energy level of air-fuel mixture is fluctuating irregularly. In summary,
this test result proves that VID can improve performance improvement per
engine-load though kept under same engine rpm and same inlet condition.
|
| |
|
| |
|
|


